Hanna L. Dolin


Micronozzle Flow


GOAL
The purpose of this project is to introduce a future student to a topic, and create a tutorial-style report for OpenFoam simulation related to the topic. This report examines inlet conditions for flow through micro-nozzles (part of micro-propulsion systems used in miniature spacecraft).


BACKGROUND
Optimization of a micro-propulsion system is extremely important because the propellant storage tank must also be miniaturized to fit in/on the nano-satellite. Shrinking the storage tank increases its surface: volume ratio, making propellant efficiency a design priority [Lekholm 2015]. The parameters used to characterize a propulsion system are change in velocity (Δv), exit velocity (v_e), Thrust, and specific impulse (Isp) [Bejhed, 2006; Kohler, 2002; Lekholm, 2015]. Isp can be considered a measurement of efficiency because greater Isp means higher thrust, F_ideal, for a given mass flow rate.


SIMULATION ASSUMPTIONS
Due to the microscale, a low Re number is assumed.

  • U = fluid velocity
  • L = characteristic length
  • ν= kinematic viscosity

The fluid is assumed Laminar, Viscous, and Compressible.
The micronozzle is a simple CD nozzle, with a rectangular cross section.

OPENFOAM SOLVER
rhoCentralFoam
  • Most often used for micronozzle simulation (per literature review)
  • Transient Compressible Flow
  • Requires Pressure, U velocity, Temperature initial values
  • Density based solver

The file structure of rhoCentralFoam is shown below:


MESH
Hand Sketch of Mesh


OpenFOAM Generated Mesh
Geometry


Boundary Conditions

*Set inviscid condition initially for simplicity.

INITIAL CONDITIONS


QUALITATIVE PRESSURE AND VELOCITY PLOTS

Pressure gradient is expected to drive flow to the right.

There is nonzero velocity to the right.

NUMERICAL AND GRID CONVERGENCE
Convergence was checked by plotting velocity values along the throat axis (red line in diagram below) for the P3 case.


Plots of the Velocity vs position along the nozzle-axis direction were checked for grid sizes of 40x40, and 80x80, both with simple grading (1 1 1), for each mesh block. The plots for P3 at time 9e-6s are shown:


Numerical convergence was checked using the same plots for times 2.4, 2.5, and 2.6 e-4s, near the minimum time needed for convergence:


THROAT NARROWING
Further investigation of the Velocity profile of P3 was conducted, through plotting Mach number vs position along the nozzle axis:

The Mach number at the geometric throat was 0.65, indicating subsonic flow. The outlet had Mach 5.5. Choked flow, Mach = 1, occurred around 525 microns, downstream of the geometric throat, which is consistent with narrowing due to viscous boundary layers despite this case having slip-condition walls. This hints at some issue with OpenFoam assigning wall boundary conditions to the micronozzle cases examined. Downstream narrowing is not expected for inviscid flow cases.

COMPARISON OF CASES: Assigned Initial Pressure (P3, P5, P7) vs Assigned Initial Velocity (U1, U2, U3)

Cases P3, P5 and P7 were compared to their corresponding velocity controlled cases, U1, U2 and U3. Plots of Mach number vs Position for each of the pairings are shown:

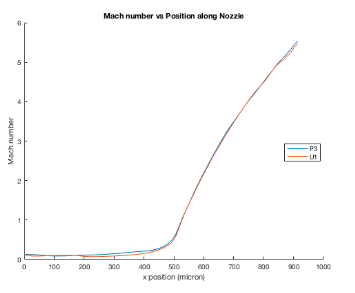
P3 and U1. Initial inlet velocity of 106 m/s.
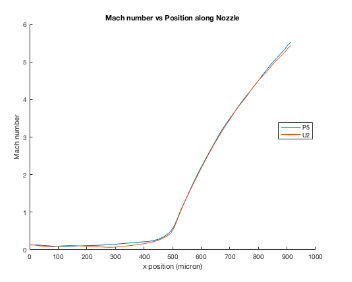
P5 and U2. Initial inlet velocity of 103 m/s.
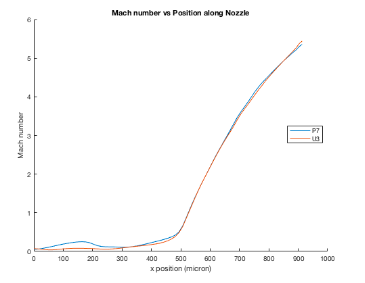
P7 and U3. Initial inlet velocity of 56 m/s.
Mach number profiles for the different initial pressure ratio cases seem to match fairly well to their corresponding initial velocity cases. The nozzle is accelerating flow in the same way for all of these cases. However inspection of the unscaled velocity profiles shows some divergence between the solutions.

P3 and U1
P5 and U2
P7 and U3
Larger initial inlet velocity seems to correspond to a larger difference between the U* case’s exit velocity and its corresponding P* case exit velocity. As discussed earlier, OpenFoam appears to be ignoring the zero viscosity and slip wall condition. Assuming that there is some partial-slip or even non-slip condition condition being set, there should be nonuniform (half-parabolic for non-slip case) velocity profiles over lines perpendicular to the nozzle axis. This would mean that Umax from the P* cases is being set as a uniform inlet velocity for the U* cases. Plots 15a-c make sense if they are comparing a nonuniform P* inlet case (therefore lower U average) to a uniform Umax U* case.

This reasoning is consistent with the velocity profiles found for the inlets of P3 and U1:

The U1 profile shows the expected flat slip profile, but the P3 case appears to show a profile more similar to a non-slip case, with velocity near the wall approaching 0 m/s.


Top